MWeb是一个强大的Markdown编辑器,除了常见的Markdown文档格式之外,还能支持一些高级绘图功能。例如:顺序图、流程图、甘特图、序列图等,甚至还能支持百度ECharts图表。
对于不是特别复杂的图表,如果能直接用Markdown代码搞定,省却了其它工具、编辑器,岂不快哉?
本博客的渲染引擎并不能直接支持这些图表功能,所以只能以图片附件的形式查看在MWeb中的渲染效果。
一、顺序图
顺序图使用 http://bramp.github.io/js-sequence-diagrams/ 画图库,以下是它在 MWeb 中的 Markdown 语法和最终效果图。
语法示例:
1
2
3
张三->李四: 嘿,小四儿, 写博客了没?
Note right of 李四: 李四愣了一下,说:
李四-->张三: 忙得吐血,哪有时间写。
效果示例: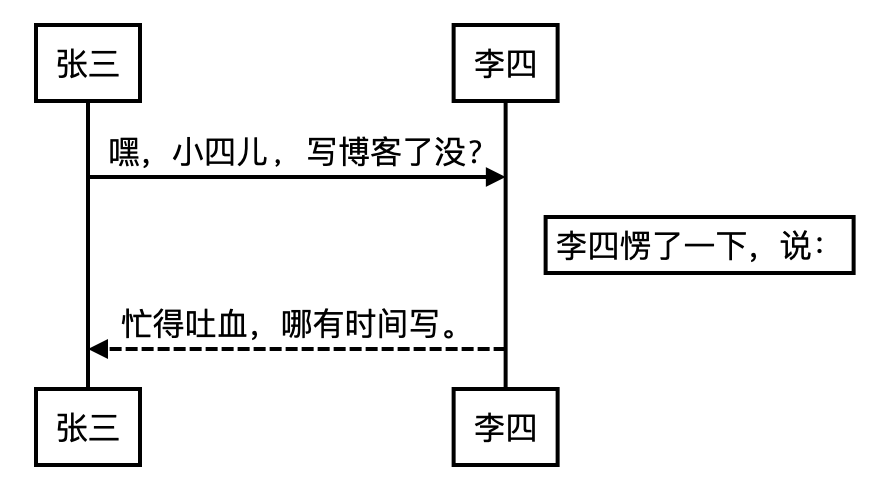
二、流程图
流程图使用了 http://adrai.github.io/flowchart.js/ 画图库,以下是它在 MWeb 中的 Markdown 语法。
语法示例:
1
2
3
4
5
6
7
8
st=>start: 开始
e=>end: 结束
op=>operation: 我的操作
cond=>condition: 确认?

st->op->cond
cond(yes)->e
cond(no)->op
效果示例: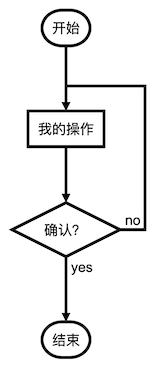
三、mermaid
mermaid 是比较流行的画图库,它支持流程图、顺序图和甘特图,它的官网为:https://mermaidjs.github.io/ ,在 MWeb 中使用 mermaid 的语法就是声明代码块的语言为 mermaid,代码块中再写上 mermaid 的画图语法即可。
3.1 流程图
代码示例:
1
2
3
4
5
graph TD;
    A-->B;
    A-->C;
    B-->D;
    C-->D;
效果: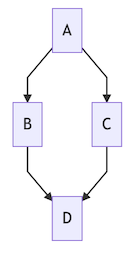
3.2 甘特图
代码示例:
1
2
3
4
5
6
7
8
9
10
11
12
13
14
15
gantt
        dateFormat  YYYY-MM-DD
        title Adding GANTT diagram functionality to mermaid
        section A section
        Completed task            :done,    des1, 2014-01-06,2014-01-08
        Active task               :active,  des2, 2014-01-09, 3d
        Future task               :         des3, after des2, 5d
        Future task2               :         des4, after des3, 5d
        section Critical tasks
        Completed task in the critical line :crit, done, 2014-01-06,24h
        Implement parser and jison          :crit, done, after des1, 2d
        Create tests for parser             :crit, active, 3d
        Future task in critical line        :crit, 5d
        Create tests for renderer           :2d
        Add to mermaid                      :1d
效果: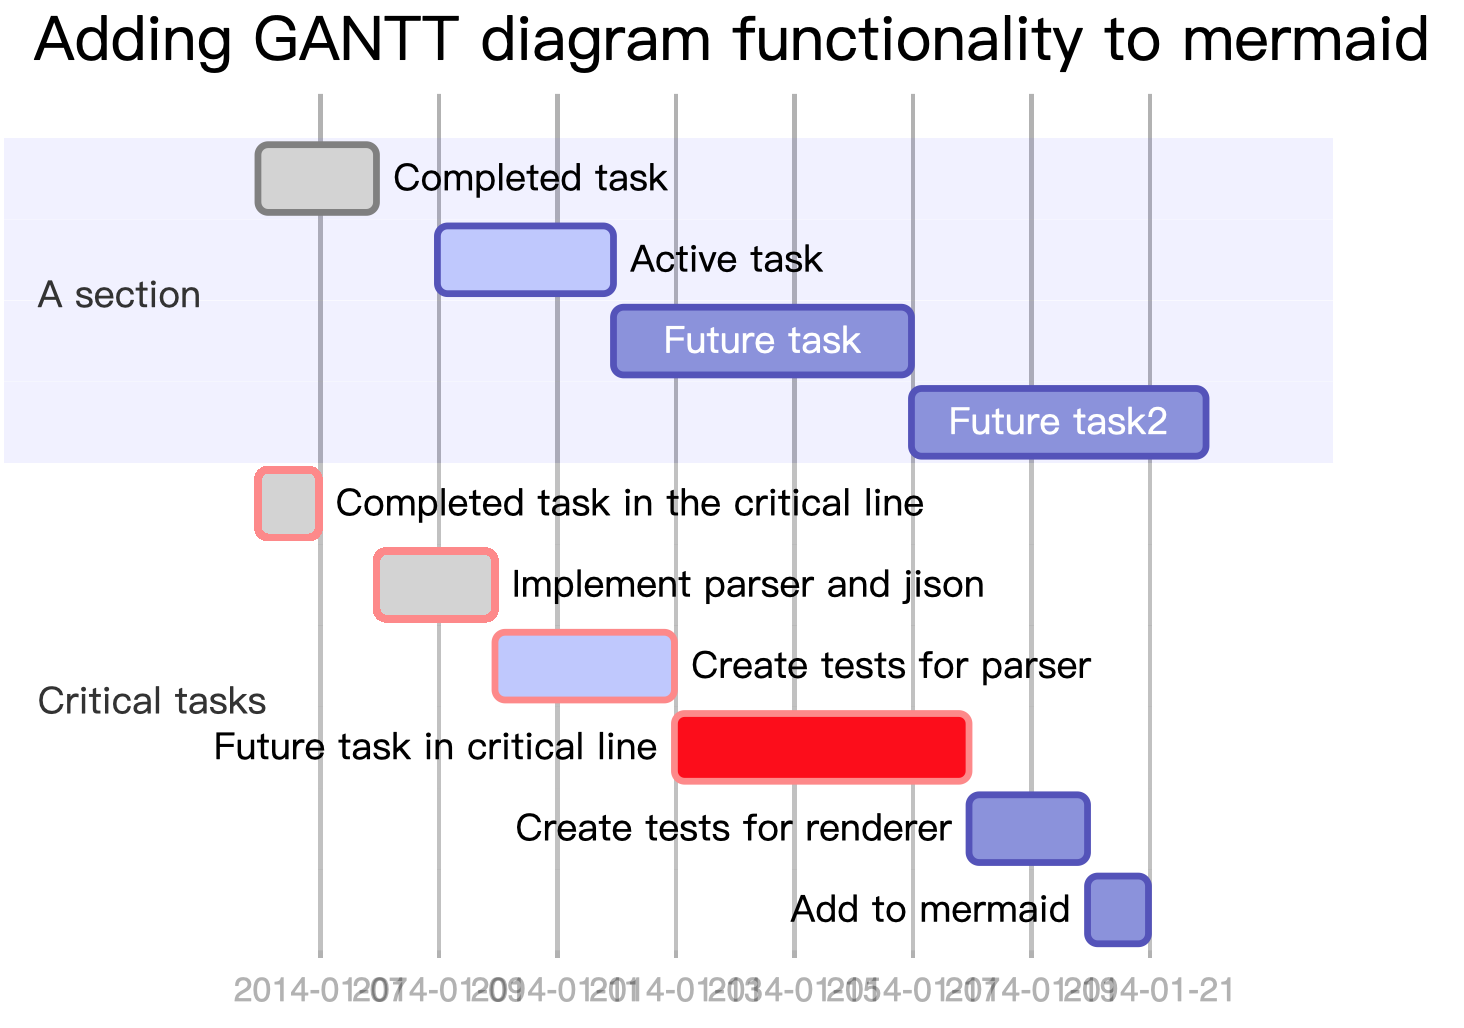
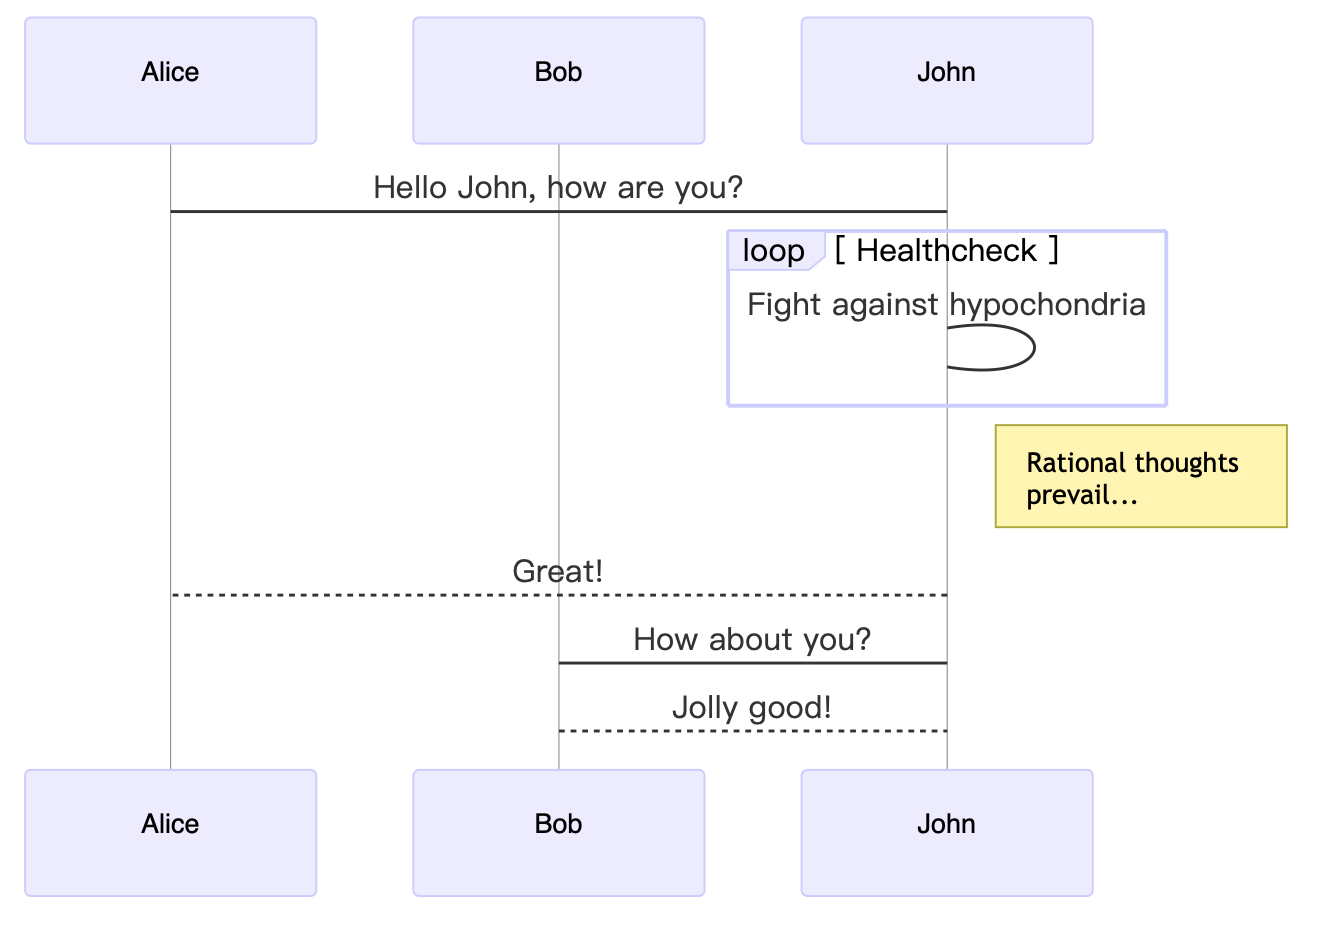
2.3 序列图
代码示例:
1
2
3
4
5
6
7
8
9
10
11
sequenceDiagram
    participant Alice
    participant Bob
    Alice->John: Hello John, how are you?
    loop Healthcheck
        John->John: Fight against hypochondria
    end
    Note right of John: Rational thoughts <br/>prevail...
    John-->Alice: Great!
    John->Bob: How about you?
    Bob-->John: Jolly good!
效果:
三、Graphviz
Graphviz 是开源的画图软件,它的官网为 http://www.graphviz.org/。MWeb 采用的是 Graphviz 的 js 版本的实现 http://viz-js.com/,可以解析 Graphviz 语法以生成图片。你可以将以下语法复制到 MWeb 中进行尝试。在尝试时可以把 dot 换成 circo, fdp, neato, osage, twopi 这几种来尝试效果。
代码:
1
2
3
4
5
6
7
8
9
10
11
12
13
14
15
16
17
18
19
20
21
22
23
24
25
26
27
28
# http://www.graphviz.org/content/cluster
digraph G {

    subgraph cluster_0 {
        style=filled;
        color=lightgrey;
        node [style=filled,color=white];
        a0 -> a1 -> a2 -> a3;
        label = "process #1";
    }

    subgraph cluster_1 {
        node [style=filled];
        b0 -> b1 -> b2 -> b3;
        label = "process #2";
        color=blue
    }
    start -> a0;
    start -> b0;
    a1 -> b3;
    b2 -> a3;
    a3 -> a0;
    a3 -> end;
    b3 -> end;

    start [shape=Mdiamond];
    end [shape=Msquare];
}
效果: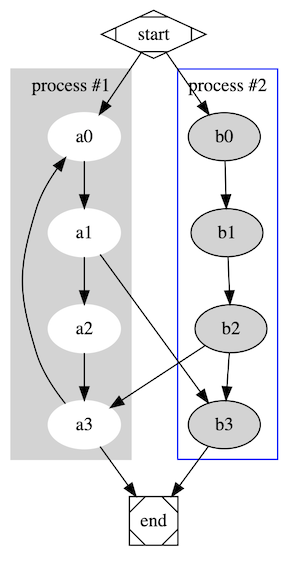
四、echarts
echarts 是百度出品的 js 画图库:http://echarts.baidu.com/index.html ,功能非常强大,国内的用户群体也相当庞大。MWeb 支持 echarts 的一些基本用法,太高级的不支持。你可以将以下语法复制到 MWeb 中进行尝试。你也可以去 http://echarts.baidu.com/examples/index.html 这个网址查看一些例子,要注意的是 MWeb 只能解析 option = {} 这种简单的,不过应该是足够使用了。
代码示例:
1
2
3
4
5
6
7
8
9
10
11
12
13
option = {
    xAxis: {
        type: 'category',
        data: ['Mon', 'Tue', 'Wed', 'Thu', 'Fri', 'Sat', 'Sun']
    },
    yAxis: {
        type: 'value'
    },
    series: [{
        data: [820, 932, 901, 934, 1290, 1330, 1320],
        type: 'line'
    }]
};
效果: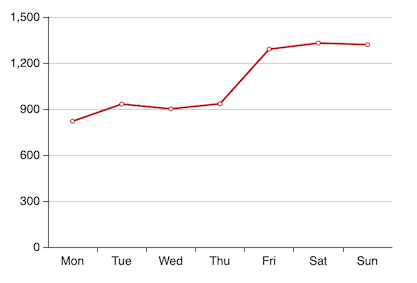
五、plantuml
plantuml 的网址为:http://www.plantuml.com。
MWeb 对 plantuml 的支持的方式是引用 plantuml 服务器生成的图片,你可以将以下语法复制到 MWeb 中进行尝试。
代码示例:
1
2
3
4
5
6
7
8
@startuml

User -> (Start)
User --> (Use the application) : A small label

:Main Admin: ---> (Use the application) : This is\nyet another\nlabel

@enduml
效果展示: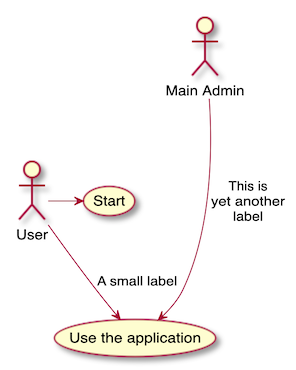
参考
更详细的使用说明,请参阅:MWweb官方介绍。